Mapping Interconnected Risk Dimensions in Multi-Game Betting Landscapes
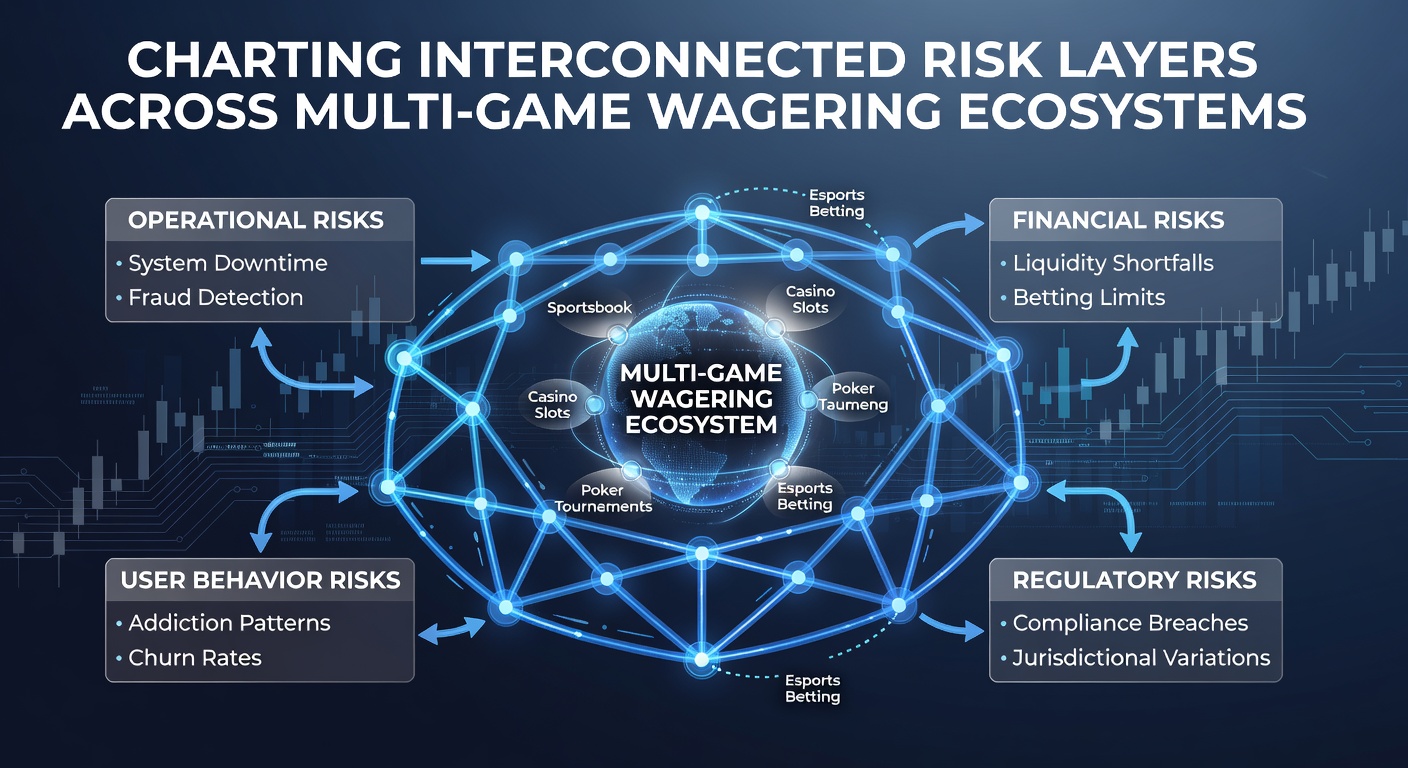
Multi-game wagering ecosystems combine sports betting, casino tables, slots, and poker rooms into single platforms where player activity crosses boundaries constantly, and risk factors from one area influence others through shared data streams and account behaviors. Observers note that these connections create layered structures where volatility in one game type transmits to another via deposit patterns or session lengths, while regulatory frameworks in various regions track these flows to assess overall exposure levels.
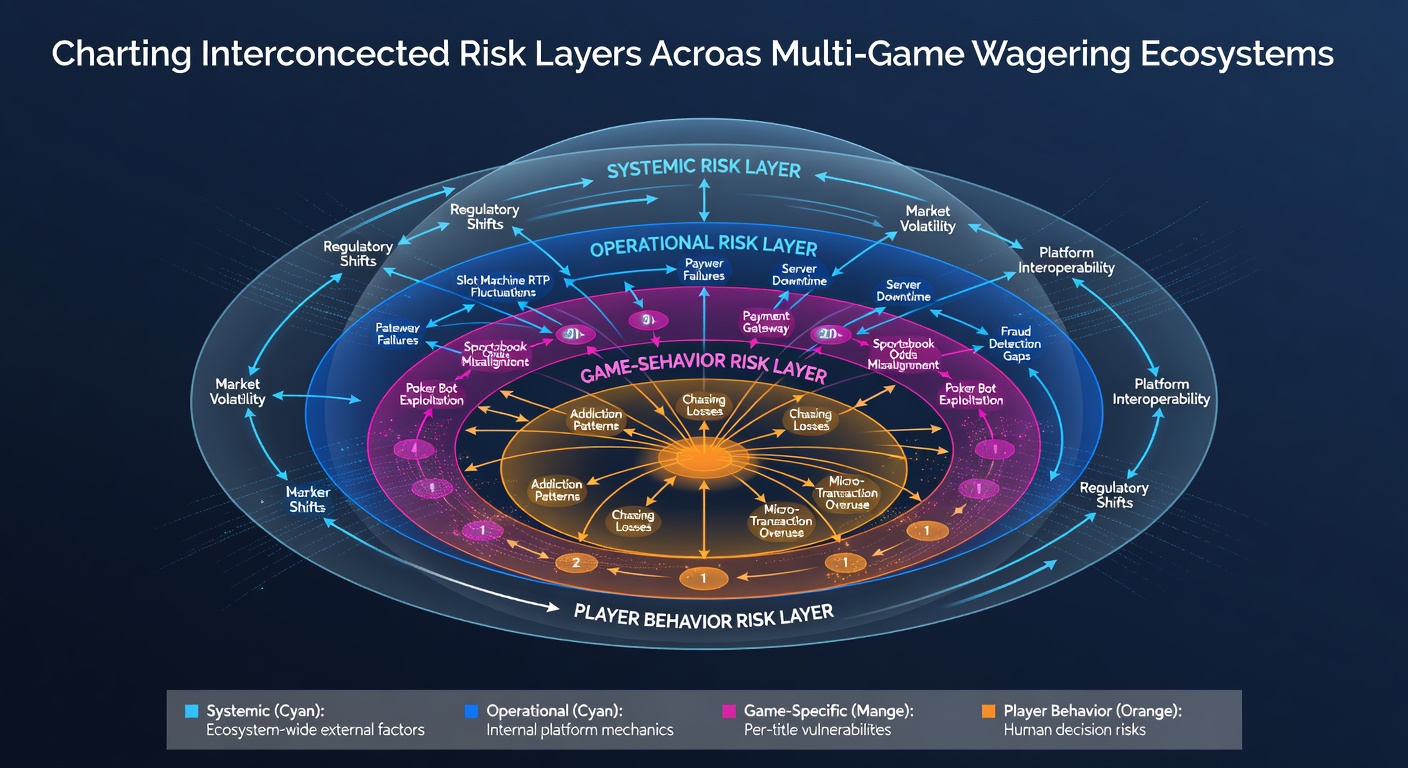
Defining Risk Layers in Integrated Wagering Systems
Individual games carry distinct risk profiles based on house edges, payout frequencies, and player decision points, yet platforms aggregate these into broader layers when users switch between options during single sessions. Data from industry reports shows how a high-volatility slot session often precedes increased stake sizes in sports markets, because the same account balance and behavioral triggers link the two activities together. Researchers at institutions like the University of Nevada have documented similar patterns where sequential play across game categories amplifies cumulative exposure beyond what isolated analysis predicts.
How Connections Form Between Game Categories
Account-level data reveals that time spent on one product correlates with adjustments in another, such as longer poker sessions leading to higher average bets on blackjack tables within the same ecosystem. Platforms record these shifts through timestamped logs and balance changes, which then feed into risk models that flag potential escalation points. According to findings from the Canadian Centre on Substance Use and Addiction, users who engage multiple verticals within short windows exhibit distinct patterns compared to single-game participants, including faster deposit cycles and wider bet spreads that cross product lines.
Examples of Cross-Game Transmission
Take a scenario where a sports bettor experiences a late loss on a live event, then moves directly to video poker machines, and the platform logs show stake increases that exceed prior norms. Such sequences demonstrate how outcome feedback from one layer affects decision thresholds in the next, creating feedback loops that monitoring systems must capture in real time. Studies published through academic channels indicate these transitions occur more frequently on mobile interfaces, where switching requires fewer steps and session continuity remains unbroken.
Data Patterns Observed Across Platforms
Figures released in mid-2026 from international gaming associations highlight growth in multi-vertical accounts, with average users accessing at least three game types per month. These statistics demonstrate measurable overlaps in risk indicators, such as simultaneous rises in loss-chasing metrics across slots and table games when sports results turn negative. External analysis from the Australian Gambling Research Centre has tracked similar correlations in regional markets, noting that deposit velocity often accelerates when players alternate between high-speed and strategic options without breaks.
June 2026 updates to several international reporting standards emphasized the need for unified tracking across game categories, because fragmented oversight misses the cumulative effects that emerge only when data sets combine. Platforms that implemented cross-layer alerts reported earlier identification of accounts showing sustained elevation in multiple risk signals at once.
Tools and Models for Charting These Layers
Operators deploy graph-based analytics to visualize how individual risk elements connect, mapping nodes for each game type and edges for observed player transitions. These models assign weights to connections based on frequency and magnitude of influence, allowing clearer identification of central points where multiple layers intersect. Evidence from operational case studies shows that such visualizations help isolate clusters where sports outcomes drive subsequent casino activity spikes more reliably than random chance would suggest.
Integration with external data sources, including transaction histories and device usage logs, strengthens these charts by adding temporal dimensions that reveal how risks evolve over hours or days rather than single sessions. Research teams continue refining algorithms to distinguish between deliberate diversification and reactive switching that signals heightened exposure.
Conclusion
Multi-game wagering ecosystems generate risk structures that single-category analysis cannot fully capture, because connections between products transmit behavioral and financial signals across boundaries. Comprehensive charting requires combined datasets and models that account for sequential play patterns documented in multiple regions. As platforms expand vertical offerings through 2026, the emphasis on interconnected tracking continues to shape how exposure gets measured and managed across the entire landscape.