Navigating Probability Structures: Parallels Between Sports Odds and Casino Payouts

Probability structures underpin both sports wagering and casino operations, where operators embed margins into quoted figures that reflect calculated risks rather than pure chance alone. Bookmakers convert event likelihoods into odds formats such as decimal, fractional, or American moneyline representations, each of which implies a specific probability while accounting for the bookmaker's commission commonly known as the vig or overround. Casino games operate on similar principles through house edges that ensure long-term retention of a percentage of all wagers placed, whether through reel combinations in slots or fixed rules in table games like roulette and blackjack.
Core Mechanics of Sports Odds Calculation
Operators assess multiple variables including team performance histories, player injuries, weather conditions, and market movements before setting initial lines, then adjust those lines dynamically as bets arrive to balance exposure across both sides of a proposition. The resulting odds always incorporate an overround that exceeds 100 percent in total implied probabilities, creating the margin that sustains the business regardless of individual event outcomes. Data compiled across major leagues shows typical overrounds ranging from 2 to 5 percent in competitive football markets and higher in less liquid niche sports, figures that remain consistent even as betting volumes fluctuate throughout a season.
House Edge Structures in Casino Environments
Casino payouts derive from predefined mathematical models where each game carries a fixed or variable return-to-player percentage that directly translates into the house edge; European roulette wheels with a single zero maintain a 2.7 percent edge while American double-zero variants increase that figure to 5.26 percent. Slot machines publish theoretical RTP values that operators must meet under regulatory testing, yet actual short-term results deviate due to random number generator variance, a pattern that mirrors how sports odds can shift dramatically in live betting scenarios. Those who have examined payout tables across thousands of titles note that progressive jackpot games often lower base RTP to fund the accumulating prize, a deliberate trade-off that parallels how sportsbooks offer enhanced odds on specific accumulator bets to attract volume.
Direct Parallels in Margin Application
Both industries rely on the law of large numbers to realize their built-in advantages, where individual bettors or players may experience short-term gains yet the aggregate of thousands of decisions produces predictable operator profits. Sports odds and casino payouts both adjust for liquidity and bettor behavior; heavily backed outcomes see shortened prices in the same way popular slot titles receive tighter reel configurations or reduced bonus frequencies. Research from international gaming associations indicates that operators monitor real-time data streams to recalibrate these structures, ensuring margins stay intact amid changing participation patterns. In June 2026 several North American and Australian regulators published updated compliance reports showing how digital platforms now apply identical algorithmic tools to both sports and casino verticals, tightening the connection between the two sectors.
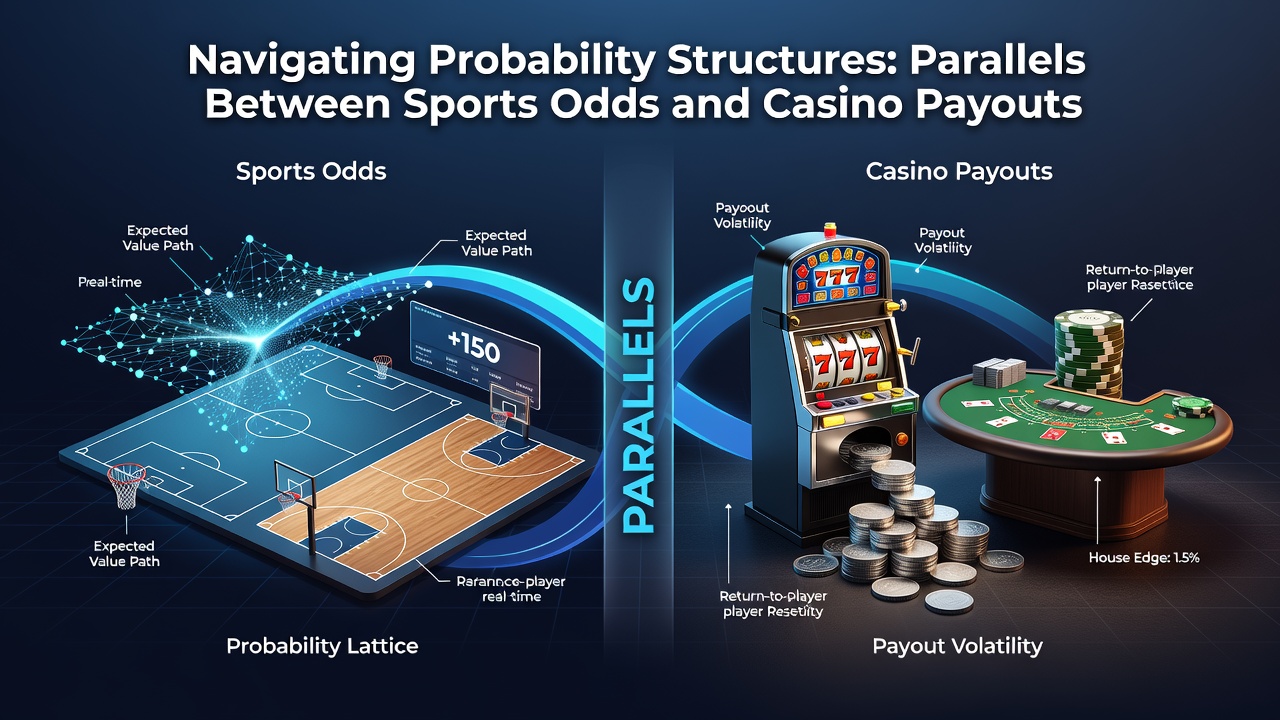
Take one analyst who tracked decimal odds across European football leagues alongside RTP figures from regulated online casinos; the study revealed that both formats compress true probabilities by comparable percentages once the operator margin is removed. This compression appears in accumulator bets where multiple selections compound the overround and in multi-line slot sessions where the combined house edge across activated paylines produces similar long-term erosion of player funds. Observers note that professional syndicates exploit small discrepancies between correlated markets in sports while similar mathematical approaches surface in video poker strategy charts that minimize but never eliminate the house edge.
Regulatory Influences on Probability Presentation
Government agencies across different jurisdictions enforce transparency requirements that affect how probabilities reach the public; Nevada's gaming authorities mandate clear disclosure of house edges on all table games and machines, while Canadian provincial regulators require sportsbooks to publish odds in standardized formats that allow direct comparison of implied probabilities. These rules create an environment where informed participants can calculate the exact cost of participation, a process that becomes more complex when operators introduce dynamic pricing tools that respond to live action in both sports and casino products. Industry reports from bodies such as the American Gaming Association document how these disclosures have grown more detailed as digital platforms handle increasing transaction volumes.
Practical Implications for Participants
Individuals comparing options across verticals quickly encounter the shared reality that no betting format offers positive expected value once the margin is factored in, yet variance allows for sequences of favorable results that sustain engagement. Bankroll management techniques developed for sports betting, such as staking plans that limit exposure per event, translate directly to casino sessions where players set loss limits based on the known house edge of their chosen game. Data from academic studies on gambling behavior shows participants who understand these parallels tend to allocate resources across both domains with greater awareness of cumulative costs, even when promotional offers temporarily alter displayed odds or payout percentages.
Conclusion
Probability structures in sports odds and casino payouts rest on identical foundational mathematics that operators apply through different presentation formats yet achieve comparable economic outcomes. The margins embedded in each system ensure sustainability while participants navigate varying levels of transparency depending on regulatory jurisdiction and product type. Continued integration of data analytics across both sectors suggests these parallels will deepen as platforms unify risk management tools and compliance standards evolve through 2026 and beyond.